目前有很多Linux服务器监控工具。他们对别人有强弱之分。为了获得更多关于Linux服务器监控的信息,可以使用dstat。
null
dstat的特性是连接来自vmstat、netstat、mpstat等工具的信息、同时显示统计信息、列表排序、导出到CSV。
如何安装 dstat公司 在Linux中
dstat可以从官方的ditributions存储库获得。在本教程中,我们将使用fedora,但Ubuntu、Debian也有相同的操作。
$ sudo dnf install dstat -y
安装速度很快,因为它小到197k。
dstat公司 救命
可以通过dstat命令的-h参数获得快速帮助
$ dstat -h Usage: dstat [-afv] [options..] [delay [count]] Versatile tool for generating system resource statistics Dstat options: -c, --cpu enable cpu stats -C 0,3,total include cpu0, cpu3 and total -d, --disk enable disk stats -D total,hda include hda and total -g, --page enable page stats -i, --int enable interrupt stats -I 5,eth2 include int5 and interrupt used by eth2 -l, --load enable load stats -m, --mem enable memory stats -n, --net enable network stats -N eth1,total include eth1 and total -p, --proc enable process stats -r, --io enable io stats (I/O requests completed) -s, --swap enable swap stats -S swap1,total include swap1 and total -t, --time enable time/date output -T, --epoch enable time counter (seconds since epoch) -y, --sys enable system stats --aio enable aio stats --fs, --filesystem enable fs stats --ipc enable ipc stats --lock enable lock stats --raw enable raw stats --socket enable socket stats --tcp enable tcp stats --udp enable udp stats --unix enable unix stats --vm enable vm stats --vm-adv enable advanced vm stats --zones enable zoneinfo stats --list list all available plugins --plugin enable external plugin by name (see --list) -a, --all equals -cdngy (default) -f, --full automatically expand -C, -D, -I, -N and -S lists -v, --vmstat equals -pmgdsc -D total --bits force bits for values expressed in bytes --float force float values on screen --integer force integer values on screen --bw, --black-on-white change colors for white background terminal --color force colors --nocolor disable colors --noheaders disable repetitive headers --noupdate disable intermediate updates --output file write CSV output to file --profile show profiling statistics when exiting dstat delay is the delay in seconds between each update (default: 1) count is the number of updates to display before exiting (default: unlimited)
跑步 dstat公司
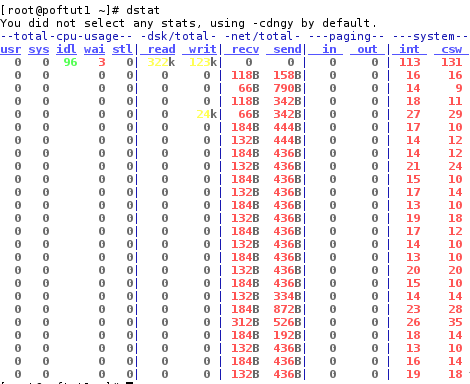
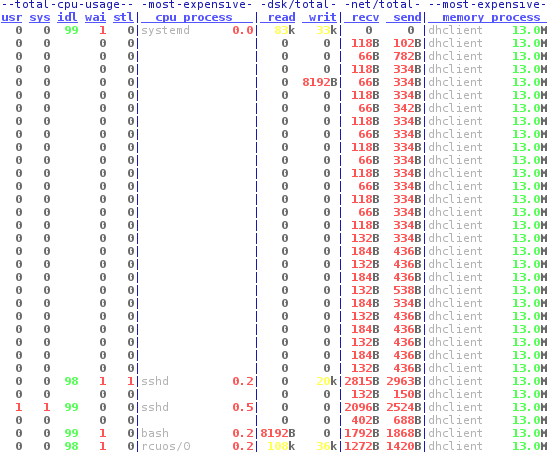
在没有参数的情况下运行dstat可以得到总cpu使用率、dsk读/写、网络发送/接收、分页和中断。
$ dstat
使用dstat获取内存相关信息
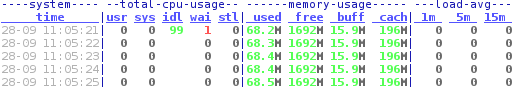
通过提供 --vmstat 参数我们可以得到与内存相关的信息,缓冲区,缓存,读/写信息如下。
[[email protected] ~]# dstat --vmstat
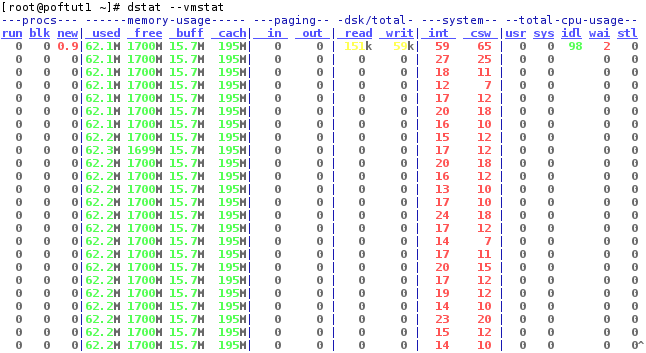
如您所见,内存使用率非常低,大约为6200万。
获取顶级流程 dstat公司
dstat可以使用具有 --top-cpu 和 --top-mem 参数。
$ dstat -c --top-cpu -dn --top-mem
正如您看到的,顶级CPU会随着时间的推移而变化。空条目意味着dstat是顶级进程。
相关文章: 什么是我的DNS服务器和热更改DNS服务器的Windows,Linux?
导出自 dstat公司 到Csv
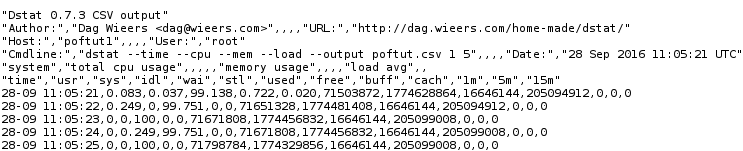
dstat条目可以导出为CSV或类似格式。下面是一个示例,它以1秒的间隔将5个条目导出到poftut.csv中
$ dstat --time --cpu --mem --load --output poftut.csv 1 5
$ less poftut.csv
列表 dstat公司 插件
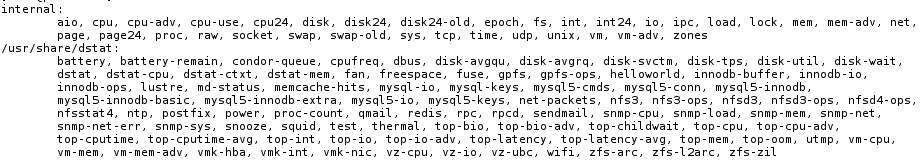
dstat有很多插件可以使用,比如nfs、sm-rpc-info。要获得完整列表,请使用 --list 参数。
$ dstat --list
Dstat-监视Linux服务器性能信息图

© 版权声明
文章版权归作者所有,未经允许请勿转载。
THE END

![关于”PostgreSQL错误:关系[表]不存在“问题的原因和解决方案-yiteyi-C++库](https://www.yiteyi.com/wp-content/themes/zibll/img/thumbnail.svg)